A simple method for including Māori vowels in R plots

My Kiwi buddy Andrew Gormley was having trouble including the Māori language vowels with macrons (ā, ē, ī, ō, ū) in his R plots.

I wrote a quick R function “maorify.r” (code in the gist below), which provides a simple method for including these characters in R plots without having to type out the unicode in full each time. I’m sure there’s a simpler or more general purpose way to do this, but it does work. Perhaps it might be useful to anyone analysing Kiwi data with R.

tui

#function to substitute vowels with Maori macrons into text strings in R
#there's probably a fancier way to do this, but it works OK.
#just precede vowels requiring a macron with '@' and the function will substitute the appropriate vowel with macron.
#Handy for graph labelling etc.
maorify<-function(x){
x<-gsub("@a","\u0101", x) #macron a
x<-gsub("@e","\u0113", x) #macron e
x<-gsub("@i","\u012B", x) #macron i
x<-gsub("@o","\u014D", x) #macron o
x<-gsub("@u","\u016B", x) #macron u
return(x)
}
#Example usage
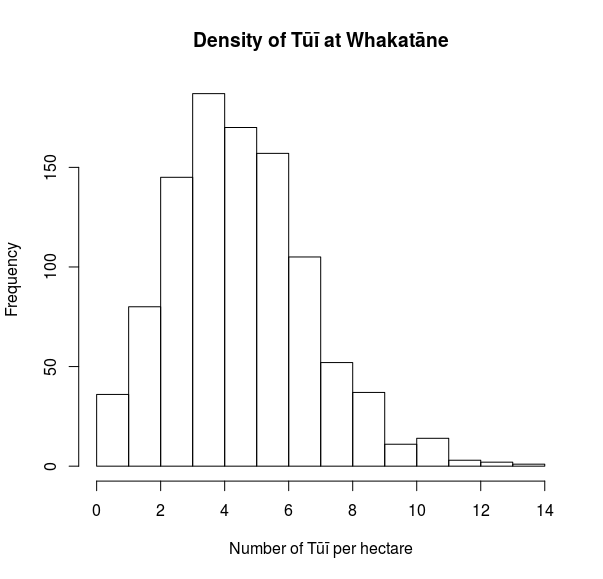
hist(rpois(1000, 5), xlab=maorify("Number of T@u@i per hectare"),
main=maorify("Density of T@u@i at Whakat@ane"))
view raw maorify.R hosted with ❤ by GitHub


Tracking #365 papers with IFTTT

After vacillating for a little while, I’ve decided to get aboard the #365papers bandwagon on Twitter.

The idea behind this initiative (with credit for originating and popularising the idea largely attributable to Jacquelyn Gill and Meghan Duffy), is that researchers make a New Year’s resolution to read a scientific paper each day for a year, and tweet about each paper using the hashtag #365papers. By setting a target for reading of papers, participating researchers are encourage to read more, and to share interesting and topical papers with their followers on Twitter.

It’s now a week into 2016, so I’m a late starter. Maybe #365papers is a little ambitious for me, and I’ll only read #100papers or #52papers, but it seems like a fun and challenging idea I’d like to try.

Having a target is one thing, but how to keep track and measure progress towards the goal? Ideally I’d like to be able to keep track of what papers I have read and when I tweeted about them, and thereby track my progress towards my goal of 365 papers for the year. One simple solution would be to maintain a spreadsheet or database, and to manually enter the details of each paper when tweeting.  That’s how Meghan kept track of her #365papers progress, and it seems to work well. But perhaps there’s a better, more automated way to achieve the same result?

I’ve long been a fan of the web service IFTTT. Simply put, this free service provides a framework for linking together the different web services in intelligent ways, so as to automate common (and not-so-common) tasks. There’s an endless range of useful things you can do with IFTTT, from having it email you when you are mentioned on Facebook, to sending you an SMS when there is a storm warning for your area, or alerting you to interesting things to buy on Ebay.

The power of IFTTT is it’s integration with an enormous range of popular web services. Naturally enough, IFTTT includes integration with Twitter, and it also includes integration with Google Drive’s online spreadsheet software. To solve my #365papers tracking needs, I have set up an IFTTT recipe that monitors my twitter feed for tweets I have made that include the hashtag #365papers. When the IFTTT detects such a tweet, it copies the details of the tweet (time, date, text etc) into a new row on a google spreadsheet I have set up. The spreadsheet will now contain an automatic, up-to-date record of my #365papers  progress (or lack thereof!). If my lack of progress isn’t too embarrassing, I might share some details of how I go in another post.

Screenshot 2016-01-07 14.15.26

Details of my IFTTT recipe to track my #365papers progress

Screenshot 2016-01-07 16.22.45

….and the resulting spreadsheet on GoogleDrive


Adding phylopic.org silhouettes to R plots

Over at phylopic.org there is a large and growing collection of silhouette images of all manner of organisms – everything from Emus to Staphylococcus. The images are free (both in cost, and to use), are available in vector (svg) and raster (png) formats at a range of resolutions, and can be searched by common name, scientific name and (perhaps most powerfully) phylogenetically.

[EDIT: as two commenters have pointed out, not all phylopic images are totally free of all restrictions on use or reuse: some require attribution, or are only free for non-commercial use. It’s best to check before using an image, either directly at the phylopic webpage, or by using the phylopic API]

Phylopic images are useful wherever it is necessary to illustrate exactly which taxon a graphical element pertains to, as pictures always speak louder than words.

Below I provide an example of using phylopic images in R graphics. I include some simple code to automatically resize and position a phylopic png within an R plot. The code is designed to preserve the original png’s aspect ratio, and to place the image at a given location within the plot.

library(png)
library(RCurl)
#I got these free png silhouettes of red fox and rabbit from phylopic.org
foxurl<-"http://phylopic.org/assets/images/submissions/51b1b6e4-129d-41a6-bbbd-c3fab459c25f.1024.png&quot;
raburl<-"http://phylopic.org/assets/images/submissions/1e15411c-5394-4a9d-a209-76c8ac0c331d.1024.png&quot;
fox_logo <- readPNG(getURLContent(foxurl))
rab_logo <- readPNG(getURLContent(raburl))
#utility function for embedding png images at specified fractional sizes in R plots
#places the logo centred on a specified fraction of the the usr space,
#and sizes appropriately (respects aspect ratio)
logoing_func<-function(logo, x, y, size){
dims<-dim(logo)[1:2] #number of x-y pixels for the logo (aspect ratio)
AR<-dims[1]/dims[2]
par(usr=c(0, 1, 0, 1))
rasterImage(logo, x-(size/2), y-(AR*size/2), x+(size/2), y+(AR*size/2), interpolate=TRUE)
}
#Demo: a time-series plot of fake fox and rabbit abundance data with phylopic logos overlaid
pdf("fox_plot.pdf", width=6, height=10)
layout(matrix(1:2, nrow=2))
set.seed(122)
plot(y=50*cumprod(exp(rnorm(30, 0.05, 0.1))), x=1981:2010, xlab="Time", pch=16,
ylab="Fox abundance", las=1, col="tomato", lwd=2, type="o", ylim=c(0, 150))
#adding a fox silhouette logo near the bottom righthand corner
logoing_func(fox_logo, x=0.10, y=0.90, size=0.15)
title(main="Index of fox abundance, 1981-2010")
plot(y=50*cumprod(exp(rnorm(30, -0.05, 0.2))), x=1981:2010, xlab="Time", pch=17,
ylab="Rabbit abundance", las=1, col="orange", lwd=2, type="o", ylim=c(0, 150))
#adding a fox silhouette logo near the bottom righthand corner
logoing_func(rab_logo, x=0.10, y=0.90, size=0.15)
title(main="Index of rabbit abundance, 1981-2010")
dev.off()
view raw logo_add.r hosted with ❤ by GitHub

A plot with phylopic logos

I should also point readers to Scott Chamberlain‘s R package fylopic, which provides the ability to make use of the phylopic API from within R, including the ability to search for and download silhouettes programatically.

If you find phylopic useful, I’m sure they would appreciate you providing them with silhouettes of your study species. More information on how to submit your images can be found here.

Applying a circular moving window filter to raster data in R

The raster package for R provides a variety of functions for the analysis of raster GIS data. The focal() function is very useful for applying moving window filters to such data. I wanted to calculate a moving window mean for cells within a specified radius, but focal() did not provide a built-in option for this. The following code generates an appropriate weights matrix for implementing such a filter, by using the matrix as the w argument of focal().

require(raster)
#function to make a circular weights matrix of given radius and resolution
#NB radius must me an even multiple of res!
make_circ_filter<-function(radius, res){
  circ_filter<-matrix(NA, nrow=1+(2*radius/res), ncol=1+(2*radius/res))
  dimnames(circ_filter)[[1]]<-seq(-radius, radius, by=res)
  dimnames(circ_filter)[[2]]<-seq(-radius, radius, by=res)
  sweeper<-function(mat){
    for(row in 1:nrow(mat)){
      for(col in 1:ncol(mat)){
        dist<-sqrt((as.numeric(dimnames(mat)[[1]])[row])^2 +
          (as.numeric(dimnames(mat)[[1]])[col])^2)
        if(dist<=radius) {mat[row, col]<-1}
      }
    }
    return(mat)
  }
out<-sweeper(circ_filter)
return(out)
}

This example uses a weighs matrix generated by make_circ_filter() to compute a circular moving average on the Meuse river grid data. For a small raster like this, the function is more than adequate. For large raster datasets, it’s quite slow though.

#make a  circular filter with 120m radius, and 40m resolution
cf<-make_circ_filter(120, 40)

#test it on the meuse grid data
f <- system.file("external/test.grd", package="raster")
r <- raster(f)

r_filt<-focal(r, w=cf, fun=mean, na.rm=T)

plot(r, main="Raw data") #original data
plot(r_filt, main="Circular moving window filter, 120m radius") #filtered data